Back-to-School Activities
Featured Topic: Back-to-School Glyphs
Glyphs are a pictorial form of data collection. You might be reminded of the term "hieroglyphics" and think about early picture writing. Different forms of glyphs are used in many medical situations to quickly record data about a patient in pictorial form. For example, a dentist records cavities on a picture of teeth. A chiropractor might record injuries or muscle aches on a skeletal picture. In these cases, a "picture is worth a thousand words" and the glyph allows a doctor to more quickly record and analyze the data.
Students in elementary school often create paper art projects for different seasons or holidays. It is easy to transform these traditional projects into mathematical glyphs that allow students to organize and analyze data over several visits.
Use glyphs to collect and organize data about students in the class. Use data analysis activities to analyze and graph class data results to help students get acquainted with each other at the beginning of the school year.
There are many good templates for glyphs in both books and online that have been developed primarily for use by elementary students. One favorite glyph is "Face It, We're Cute!" found in Super Graphs, Venns & Glyphs by Honi Bamberger and Patricia Hughes. This data collection activity is especially appropriate as a beginning of the school year activity as it collects data about each student in the class (birthday, how many brothers & sisters, how many people in family, first name, favorite subject, etc.) which is then presented as a face with features and accessories that capture the data.
Back-to-School Glyph Web Resources
Check out these back-to-school glyph ideas for samples that creative teachers have developed and made available on the web. Be sure to modify the legend to fit your class, your location and your plans for data analysis. NOTE: You may need to scroll down on some sites to locate the glyph directions.
-
 Apple glyph [scroll down]
- Getting to Know You Zipper Pull glyph
- Look at Me glyph
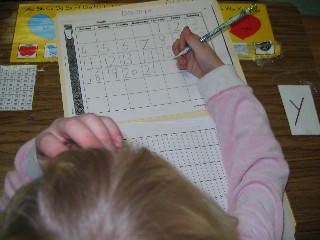
- Name glyph [scroll down] [pictured at right]
- School Bus glyph [samples presented on pages 5-6. Create your own legend to fit your students.]
- Shoe glyph
- Sunflower and Flower glyphs
- This Is Me! glyph
- T-shirt glyph
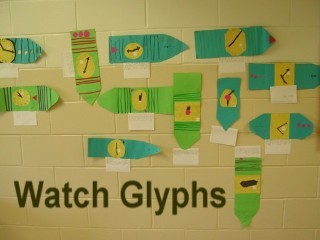
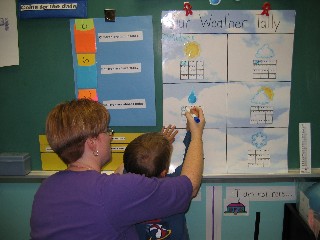
- Watch glyph [See picture above.]
- Watermelon glyph [scroll down]
See  Math Glyphs for additional background, photos of student glyphs and links to glyphs students can make throughout the school year.
Math-Literature Connections: What's in a Name?
These activities were developed to help students learn and recognize the names of their classmates:
Chrysanthemum: Chrysanthemum by Kevin Henkes presents an excellent opportunity for a data collection activity as students collect data on the lengths of their names, comparing them to the length of Chrysanthemum's name. Some primary teachers use this as an introductory reading activity in the beginning of the year as students learn to "read" their classmates' names. A video of this book is also available as a possible culminating activity.
Teachers may also extend the book to include more formal data anaylsis through line plots, graphing and identifying statistical landmarks (median, mode, range) of the collected data.
Suggested Math Activities:
- See A Step by Step Lesson with Marilyn Burnsfor more ideas on using this book to promote math connections.
- Download
 How Much Is Your Name Worth? as an additional math activity to accompany this book. Extend the activity by creating a line plot of the values of student names and analyzing the results, as appropriate, for the grade level.
- Explore letter symmetry in student names. Which upper case/lower case letters are symmetric? Extend the activity by creating a class graph showing how many symmetric letters are in first or last names of students in the class. Identify the range, mode, median of the data.
Back-to-School Problem Solving
September is a great time for data collection activities as students are naturally curious about their new classmates. Ask questions that require students to analyze data and support their conclusions.
Challenge students to solve some of these problems to practice collecting, organizing and analyzing data in real-life applications. Require students to explain their reasoning and solution to develop mathematical communication skills.
Grades K-2:
- Birthdays requires students to interpret data in a bar graph.
- Favorite Pets requires students to analyze the information in a tally chart of students' favorite pets.
- Pet Survey equires that students use data in a frequency table to construct a bar graph and answer questions about the graph.
- Favorite Ice Cream requires students to analyze the information in a tally chart about chocolate and vanilla ice cream.
Grades 3-4:
- The Third Graders problem uses the letters in "THIRD GRADERS" and investigates the probability of pulling different letters from the bag.
- The Favorite Pets problem requires students to complete a tally chart, answer questions about the data and create a bar graph of the survey results.
- In iPod Songs students must read data in a table and create a bar graph of the results.
- Lunch Choices investigates the combinations, given different menu choices.
- Back to School Crypto-List: can your students break the code in this back to school list? A letter-frequency chart might help the process. See more Crypto-Lists.
See all Problem Solving Resources
Morning Routines
Daily Math Routines: these routines help students see how math is used in everyday life. Students build strong number sense while developing proficiency with counting and calendar routines.
- See Morning Math Routines for descriptions of the daily math routines commonly used in K-2 classrooms and to download charts for some of the routines.
- See Morning Math Routines: Photo Gallery for photos of how different teachers organize these routines in their classrooms.