Koch Snowflake |
Penguin Math |
Snowflake Activities |
Snowman Problem Solving |
Literature Connections |
Winter Glyphs |
Winter Data Collection |
Gingerbread Math Activities |
Winter Coordinate Graphing |
Holiday Problem Solving |
Student Work: Winter Math Activities |
Student Work: Holiday Math Activities|
Winter Math Activities
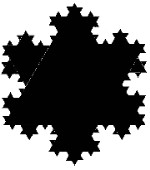
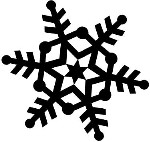
Koch Snowflake
The Koch Snowflake is an example of an iterative drawing as each successive stage begins with the previous stage. The Koch snowflake begins with an equilateral triangle. The first iteration divides each side of the triangle into thirds, removes the middle third and replaces it with two line segments of the same length. Students might visualize this as constructing a smaller equilateral triangle on the middle third, then removing the original middle third line segment. Students can construct the first couple of iterations with pencil, paper and a ruler for measuring and marking each side into thirds. Once students experience the first two or three iterations of the Koch Snowflake, they will need to see a computer-generated version in order to see how the perimeter of this snowflake increases through many iterations.
 Koch Snowflake: Cynthia Lanius java applet that allows students to see each successive iteration of the figure [online activity]
 Koch Snowflake: diagrams of first three iterations in black on white background.
- Koch's Snowflake at Shodor Interactive
- Create a Koch Snowflake with this drag-and-drop colorful online applet [online activity]
- Anti-Snowflake: Cynthia Lanius instructions and Java applet for this variation on the Koch Snowflake iteration [online activity]
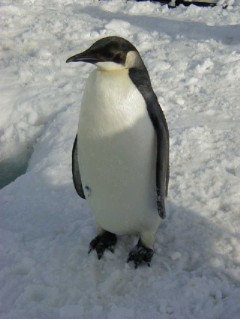
Penguin Math
Build on students' natural fascination with penguins by including these math pattern activities:
- Pascal's Penguins - 1 introduces primary students to a small version of Pascal's Triangle in this simple patterning activity.
- Pascal's Penguins - 2 introduces a larger version of Pascal's triangle and encourages students to identify the different patterns within the triangle and use these patterns to fill in the missing penguin numbers.
- Penguin Parade: pattern problem-solving task that asks students to figure out how many penguins marched in the parade, given the marching pattern. PDF file contains problem, challenge and solution.
- Penguin Puzzler: pattern problem-solving challenge that provides the total number of penguins and requires students to analyze the pattern to discover how many many rows of penguins marched in the parade. PDF file contains problem and solution.
- Penguin Tangrams
- Place the Penguins Game prompts students to place penguins on the correct multiple of 100, 10 and 0 in the number grid to make the given number.
Snowflake Activities
- Snowflake Symmetry requires students to create symmetrical snowflakes from white paper. Each student folds a sheet of blue paper and glues the snowflake to the blue paper along a line of symmetry. Each student cuts his/her snowflake in half on the fold. The snowflake halves are then scrambled and students must use symmetry to find the matching halves.
- Online directions for this activity
- See Snowflake Patterns for patterns that can be printed and then used to create different snowflake designs.
- What Makes a Snowflake Unique discusses efforts by the Cal Tech snow crystal team to answer the age-old question of whether or not all snowflakes are unique. Read this short online article for some background information on current research methods and findings. [online article]
- Snow Crystal Photographs: Capturing the fleeting beauty of snowflakes allows students to examine the structure of real snowflakes as captured by photographers around the world. [online gallery with links to other photo collections]
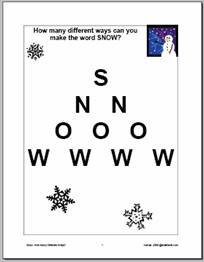
- How Many Ways Can You Make Snow? encourages students to apply the patterns in Pascal's Triangle. A teacher instructional plan with mathematical background, answer and challenge is included to explain how to present this problem. A recording sheet was also included as part of the teacher packet so that students are able to record all different solutions in a "systematic" way, which is a goal of discrete mathematics.
- Download How Many Different Ways Can You Make Snow? problem, student recording sheet, and explanation.
- Download
- Winter Paths involves systematic counting of the different Pascal paths in this arrangement of the word WINTER. Students will be challenged to relate this activity to Pascal's triangle as they analyze their solutions to see if they have found all of the ways to reach each R in the bottom row. A teacher instructional plan with mathematical background, answer and this challenge is included to explain how to present the problem. The recording sheet encourages students to trace one path in each frame, making it easy to see if students use a systematic counting approach to solving the problem.
- Download Winter Paths problem, student recording sheet, solution, and teacher instructional plan.
- Download
- Snow Day Signboard and School Closed Signboard encourage students to look for patterns in repeating letters to figure out which letter will be the 100th letter to be repeated on the signboard. Students may use division and remainders, skip counting or repeated addition to solve the problems, making them accessible to students in many grades. Each problem includes a challenge to extend the problem-solving experience and a possible solution.
- Download Snow Day Signboard
- Download School Closed Signboard
- Download
Snowman Problem Solving
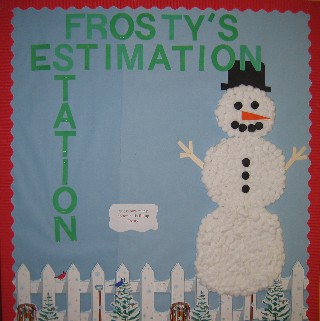
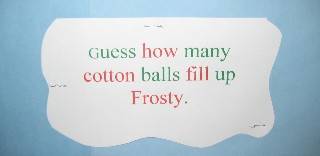
- Frosty's Estimation Station, created by Ms. O'Prandy, challenges first graders at Port Monmouth Road School in Keansburg, NJ, to estimate how many cotton balls fill up Frosty.
- Dress the Silly Snowman Game allows you to click on different snowflakes to choose the snowman's head, the snowman's middle and the snowman's base. If there are 8 different choices for each, how many different snowmen could you make? Students will quickly realize that you could make many different snowmen -- too many for primary students to count. [online activity]
- Ben & Jerry's Virtual Snowman is another site that allows students to build a snowman using different choices for hats, scarves, etc. [online activity]
- Snowman Combinations for Younger Students: After students have had the chance to visit one of the Snowman sites listed above, consider modifying this to a smaller problem for younger students by omitting some choices: Using 3 choices for hats and 3 choices for scarves, students can make 9 different snowman combinations. If each option is a different color or shape, small groups can draw pictures of the different combinations and see that there would be a total of 9 different combinations. Challenge student groups to find all of them.
- Print out the Dress the Snowman Templates so that students can color and assemble different clothing combinations for their snowmen. Remember to print extras as students will need several copies to assemble all of the different possible combinations.
- Operation Snowman: this Harcourt-Brace site presents a word problem and asks students to identify the correct operation to solve the problem. Correct responses are rewarded with a part of a snowman. Answering several problems correctly produces a full snowman and falling snow. This activity is great problem-solving practice for students who have difficulty reading word problems and deciding what operation to use. Students can play several times using different problems. Students should have conceptual understanding of addition, subtraction, multiplication and division in order to benefit from this activity.
Literature Connections
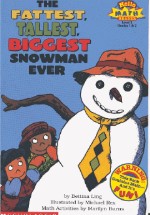
The Fattest, Tallest, Biggest Snowman Ever by Bettina Ling is a Level 2 Hello Math Reader (Gr. 1-2) that introduces students to the concept of measuring objects using nonstandard units and instruments. When neither child's arms are long enough to measure around the snowmen to see whose snowman is biggest, they decide to use a string of paper clips to measure.
- The book also provides suggestions for follow-up measurement activities such as the String-a-Long Game in which students look at (but don't touch) ordinary, everyday objects, then cut a piece of string they think is the same length as the object. Students compare their strings to the object to see whose string is closest to the length. Consider using the "String-a-Long Game" as a great measurement center activity.
- Paper-clip chains: Have students measure classroom objects using paper-clip chains. Be sure to ask students to estimate first, then measure. Students will begin to develop an "eye for distances."
What Are Glyphs?
Glyphs are a pictorial form of data collection. You might be reminded of the term "hieroglyphics" and think about early picture writing. Different forms of glyphs are used in many medical situations to quickly record data about a patient in pictorial form. For example, a dentist records cavities on a picture of teeth. A chiropractor might record injuries or muscle aches on a skeletal picture. In these cases, a "picture is worth a thousand words" and the glyph allows a doctor to more quickly record and analyze the data.
Students in elementary school often create paper art projects for different seasons or holidays. It is easy to transform these traditional projects into mathematical glyphs that allow students to organize and analyze data over several visits.
- See legend for Mrs. Ritenour's Snowman Glyph
- See legend for Lynn's Weber Snowperson Glyph
- See legend and pictures of Reindeer Glyphs
- Print out legend for Reindeer Glyph
- See legend for Gingerbread Man Glyph
- Print out Gingerbread Man Template for glyph
- See legend for Gingerbread Man Glyph 2 with blank template
- Print out Gingerbread Man Blank Template
- See Glyphs to learn more about glyphs, view student samples or for links to glyph activities on the internet.
- See samples of Student Winter Glyphs
Winter Data Collection
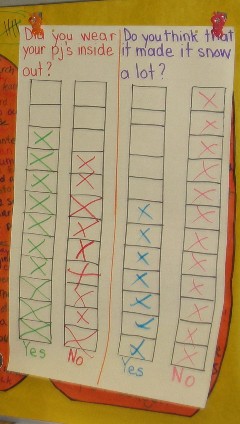
There are many possibilities for winter math data collection activities. Look for opportunities to have students create tally charts, clothespin graphs, Venn diagrams, bar and line graphs to organize data and analyze the results of the data collection. Consider using the Question of the Day to collect data, then ask students to talk about what they can learn from that data.
- Do you wear mittens or gloves? a hooded jacket or a hat?
- Daily Weather Graph or Weather Tally: have we had more cloudy or snowy days this month? How many inches of snow have we had so far this year?
- Did you wear your pajamas inside out? Do you think that made it snow a lot?
- What is your favorite season?
- What is your favorite winter activity: skiing, sledding, building snowmen, ice skating?
- Do you like building snowmen?
- Do you prefer warm weather or cold weather?
- Do you like marshmallows in your hot chocolate?
- Have you ever baked gingerbread cookies?
- Have you ever built a snowman?
- How many hours do you watch TV each day?
- How many hours of homework do you have each day?
- How many books did the class read this week?
- Do you prefer to read fiction or non-fiction books?
Gingerbread Math Activities
Many classes make gingerbread houses or gingerbread cookies as a seasonal activity. Consider emphasizing the mathematical components of these activities:
- Gingerbread Men
- Making Gingerbread cookies is a great measurement activity for younger students as they use cups, teaspoons, etc. to measure and combine the different ingredients.
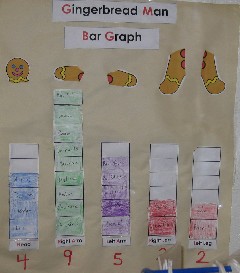
- Gingerbread Man Graph: Ask students to take one bite of their gingerbread cookie. Graph or tally how many students bit off the head, the right arm, left arm, right leg or left leg.
- Gingerbread Person Glyphs: Create gingerbread people decorations that are glyphs so that they represent the answers to different data-collection questions: boy/girl, like/don't like gingerbread, favorite dessert, etc.
- See legend for Gingerbread Man Glyph
- Print out Gingerbread Man Template for glyph
- See legend for Gingerbread Man Glyph 2 with blank template
- Print out Gingerbread Man Blank Template
- Gingerbread Math Activities
- Gingerbread Man Themed Math Pages for Grades 1-2.
- Gingerbread Houses
- Gingerbread Geometry: challenge students to find the footprint, perimeter, surface area and volume of their proposed gingerbread houses before actual construction begins. If students are covering milk cartons, small groups could use empty cartons to find the measurements and describe the tools they used for each item. Have students use customary (in.) or metric (cm.) measurements, depending on teacher choice. Volume will be a challenge to younger students but they might fill the carton with water, rice or sand and then calculate how many cm-cubes or inch-cubes would fill the same number of cups to get an estimated volume. They could also fill the house with cm-cubes if a good supply is available. Students could leave the measurement in cups, if they are studying liquid measurements.
- Download the Gingerbread Geometry worksheet for students to record measurements and how they found these measurements.
- Download the
- Decorating on a budget: Price candy decorations and allow students a certain budget to purchase decorating supplies. Allow students to plan out their house before actually constructing it.
- Patterns: encourage students to use patterns for the roof and for walkways. Students should classify the patterns as AB, AAB, etc.
- Tessellations: which candies tessellate the house surfaces by covering the entire surface without gaps or overlaps?
- Gingerbread Geometry: challenge students to find the footprint, perimeter, surface area and volume of their proposed gingerbread houses before actual construction begins. If students are covering milk cartons, small groups could use empty cartons to find the measurements and describe the tools they used for each item. Have students use customary (in.) or metric (cm.) measurements, depending on teacher choice. Volume will be a challenge to younger students but they might fill the carton with water, rice or sand and then calculate how many cm-cubes or inch-cubes would fill the same number of cups to get an estimated volume. They could also fill the house with cm-cubes if a good supply is available. Students could leave the measurement in cups, if they are studying liquid measurements.
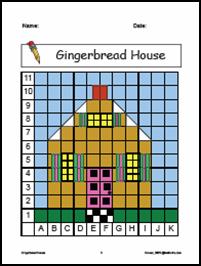
Winter Coordinate Graphing
Introduce elementary students to coordinate graphing through seasonal coloring activities. The winter Gingerbread House activity requires students to use the grid code and crayons or markers to create a gingerbread house on a blank 11x11 grid. The use of letters on the horizontal axis and numbers on the vertical axis introduces young students to coordinate pairs without the confusion of the standard (h,v) format. Notice that it is important that elementary students become accustomed to listing the horizontal coordinate first as this will transfer to the Cartesian coordinates they will use in later grades.
- Download the Gingerbread House coordinate graphing activity
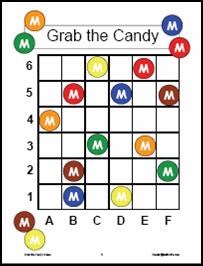
Winter Coordinate Graphing Game: Grab the Candy!
- Download the Grab the Candy Game: students toss two dice (one regular and one A-F) in this fun game that introduces students to coordinate graphing in the spaces. Students form a coordinate pair based on the dice toss and place a marker on that space, if possible. If the space holds a candy, they grab the candy for a quick five points. Create A-F dice using plain dice or purchase small wooden cubes at a craft store to make the dice. PDF contains game mat, directions, candy squares and recording sheet. [PDF]
- Download the
Gridlock Jr. Game: students toss two dice to form a coordinate pair then place a marker on the corresponding square of the coordinate grid. First player to get three markers in a row horizontally, vertically or diagonally wins the game. PDF contains game mat, directions and recording sheet. [PDF]
- Download the
Holiday Problem Solving
The Twelve Days of Christmas Song: Introduce elementary students to the mathematics behind the Twelve Days of Christmas song. The person received more than 12 gifts. In fact, students will appreciate this growing pattern as they use a table to track how many of each gift the person receives by the end of the twelfth day. Older students can retrieve the current estimated costs online, then calculate the total cost of the presents over twelve days. No matter which of the activities teachers choose, students are bound to hear the song differently after this mathematical investigation.
- See the Twelve Days of Christmas lesson plan and recording sheet from the Rutgers Leadership Program: Exploring Discrete Mathematics in the Classroom
- See the Annual PNC Price Index for the 12 days of Christmas gifts
- See the Twelve Days of Christmas and Pascal's Triangle" lesson plan and graphics explanation
- Twelve Days of Christmas: literature/math lesson plan with order form and prices
- Twelve Days of Christmas: Music Meets Math in a Popular Christmas Song relates the song to trianglular numbers and Pascal's triangle. This web article also finds a Star of David pattern in Pascal's Triangle and encourages students to explore whether the pattern holds true for other series of numbers.
- Lessons on Pascal's Triangle from Math Forum
- Twelve Days of Math: a Christmas song
- Download printable pictures of Twelve Days of Christmas gifts
- Download Twelve Days of Christmas clip art

Internet Links
White Christmas?: Students use data on the probability of U.S. cities having at least one inch of snow on the ground on Christmas day to create a contour map of the USA. Students will locate and analyze real-life contour maps on the web. By constructing their own contour map, students learn to read a contour map and appreciate the information this type of map conveys. They also see how probability is used in weather prediction.
- See Will There Be a White Christmas This Year? to view lesson plan, related web links and download USA maps for students to color
Math Mountain: Students may choose one of two problems to solve at this McREL site: .
- Goldy's Glide for Grades 2-3 extends a magic squares problem. First students create a traditional magic square placing the numbers 1-9 in a 3x3 grid so that every column and row have the same sum. Next students are challenged to create the "complete opposite" of a magic square in which none of the columns and rows have the same sum. A solution is available for students to check their work, if needed.
- Nabu's Knee Knocker for Grades 4-6 extends the Pascal's triangle problem. Students must fill in the missing numbers on a number pyramid, following the pattern that each number in a box is the sum of the two numbers directly below it.
Student Work: Winter Math Activities
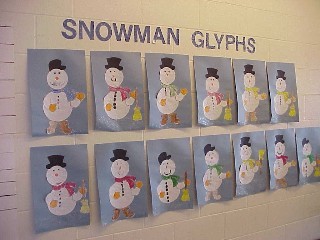
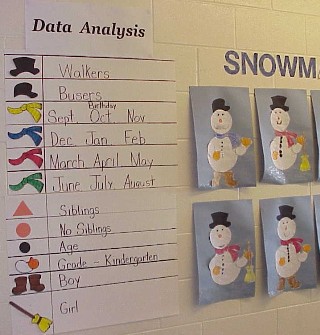
Snowman Glyphs
Students in Mrs. Arocho's kindergarten class at Patten School in Perth Amboy, NJ, created snowman glyphs to collect data about each other. Visitors could use the glyph legend to find out more about the kindergartners in this class.
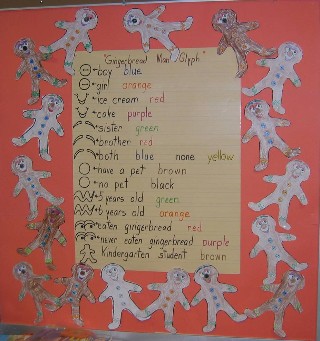
Kindergarten Glyphs
Students in Mrs. Winkleman's kindergarten class at James J.Flynn School in Perth Amboy, NJ, created gingerbread man glyphs that collected data on whether or not students liked gingerbread, number of brothers and sisters, pets and birthdays. Students used the legend to find out more about their classmates.
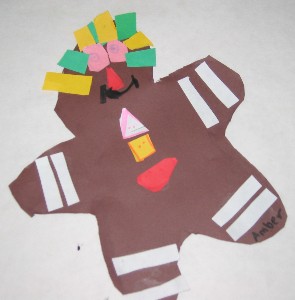
Gingerbread Man Glyphs
Mrs. Ziegler's and Mrs. Campbell's second graders at Port Monmouth Road School in Keansburg, NJ, created gingerbread man glyphs to represent data about birthdays, number of siblings and favorite things to do.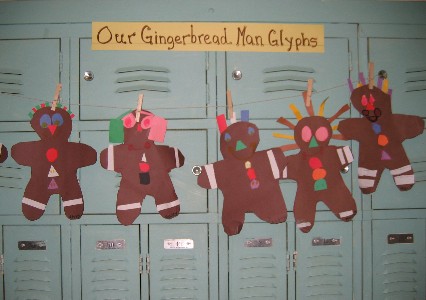
Student Work: Holiday Math Activities

Name-Collection Trees
Students in third grade at Caruso School in Keansburg, NJ, created name-collection trees for the holiday bulletin board. Each student created an ornament with a different name for the tree number, giving the Everyday Math name-collection boxes a holiday spin.
Learn more about Everyday Math Name-Collection Boxes
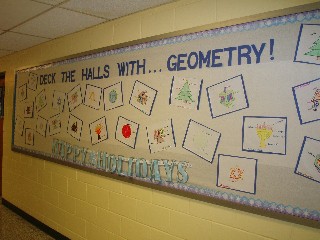
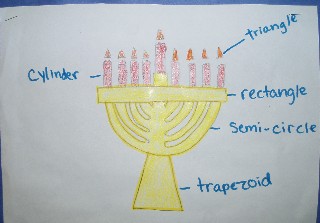
Deck the Halls with...Geometry
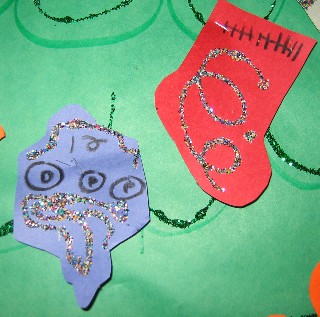
Mrs. Thal's sixth graders at Sycamore Drive School in Hazlet, NJ, investigated the geometry in holiday symbols. Students made symbols using various shapes, and then added geometric labels.
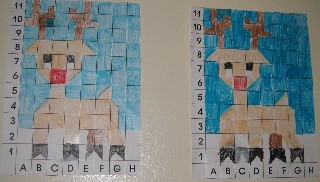
Holiday Coordinate Graphing
Ms. Collier's and Ms. Rachko's fourth graders at Caruso School in Keansburg, NJ, practiced coordinate graphing to create these reindeer pictures.
See Winter Coordinate Graphing to download activity sheets for a Gingerbread House coordinate graphing activity or directions and game mats for Grab the Candy! game which provides practice in coordinate graphing.