Data Analysis 2
Featured Topic: Data Analysis
Students are encouraged to collect real, meaningful data, organize that data and analyze the data to draw conclusions and explain what they have learned. There are many opportunities to incorporate data collection experiences within the school day.
Question of the Day
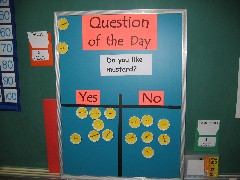
Capitalize on student interest by creating a daily data collection activity. Mrs. Soranno's kindergarten students move their name to answer the question of the day. Evidently the class is evenly split on whether or not they like mustard.
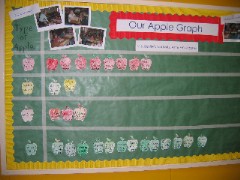
Use a variety of data organization tools: tally chart, Venn Diagram, clothespin graph, bar graph, pictograph, etc. to help students learn to organize and interpret data in these different representations.
- See Winter Data Collection Activities for some suggested data collection questions and topics
- Teachers of older students sometimes assign students the job of creating the question of the day and reporting the results to the class.
Clothespin Graphs
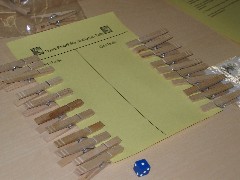
Write each student's name on a clothespin. A piece of foam core board or laminated oak tag makes a great two-choice (Yes/No) graph board. Students simply affix the clothespin to the correct side to indicate their response. Students can easily "see" the results and count to verify the outcome.
- Use this method to record the results of informal classroom surveys:
- Literature: Which character do you like best? What do you think the character will do next? Which version of the story do you prefer?
- Daily Routines: Are you buying lunch or did you bring lunch? Present or Absent?
- Ask students to report the results of who won two-player games so that the class can analyze the fairness of the games.
Seasonal Data Collection Activities
Seasonal activities, field trips and parties create opportunities for data collection that students truly enjoy. Whether they are planning for a party or a field trip, students enjoy having some input into the experience and seeing how their classmates vote as well.
Morning Routines
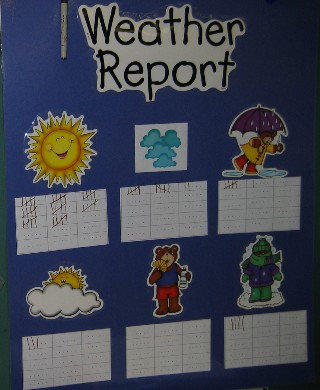
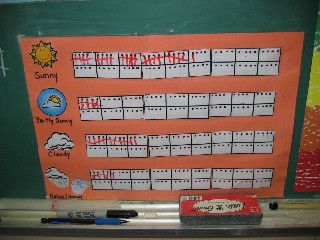
Weather results provide great data for student analysis. Students can easily compare months to see which month has more rain, snow, sun, clouds, etc.
Teachers can informally generate questions based on a quick glance at the weather chart. These questions should also ask students to predict what the upcoming weather will be like: will we have more sunny or cloudy days? more rainy or snowy days?
Finally, students can reflect on the seasons and see similarities in those months in terms of sun, rain/snow, wind, etc. Does March really come in like a lion and go out like a lamb?
See Morning Math Routines and Morning Math Routines: Photo Gallery for pictures and descriptions of these data collection activities.
More Data Collection Activities
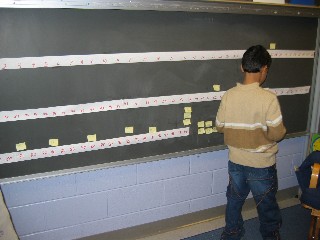
Count in a Minute: First graders at Flynn School in Perth Amboy, NJ, created a large line plot of how high they could count in a minute. Student pairs worked together to time and count then post the results on the class graph.
- The teacher presented the question to the class: How high do you think most first graders in this class can count in a minute? The teacher led a discussion that included student predictions and the reasons for their predictions.
- The teacher created a large number line on the blackboard to form the basis of the line plot. The teacher used a timer to signal the start and end of the minute.
- Students worked in pairs. First, student A counted aloud while student B listened. When the minute was over, student B wrote the highest number on a post-it and added it to the class results.
- Students repeated the experiment: student B counted aloud while student A listened. These results were then added to the class results.
- The teacher led a discussion of the results and whether or not the results were what they predicted. Why or why not?

Heads-Tails: a Probability Experiment Challenge students to analyze the fairness of this game that uses a single coin. Student A wins a point if the toss is the same as the last toss and Student B wins a point if the toss is different. Is the game fair?
- Predict: Challenge students to make predictions and explain their thinking.
- Conduct the Experiment: let student pairs play the game, collect data and add their results to the class results
- Analyze the data: do the results confirm the predictions? Are they what students expected? Why or why not? Are they satisfied with the results or do they need to collect data?
- Download
 Heads-Tails directions and recording sheet.

from the Mathwire Archives...
See more Data Analysis & Probabiity Activities including dice toss and coin flipping activities.
See Sampling Activities that introduce students to the important statistical concept of using a small sample to predict the larger population.